


Automatic synchronisation of customers and contacts as soon as data changes in either system


Connect all your departments' project tools
12 min read
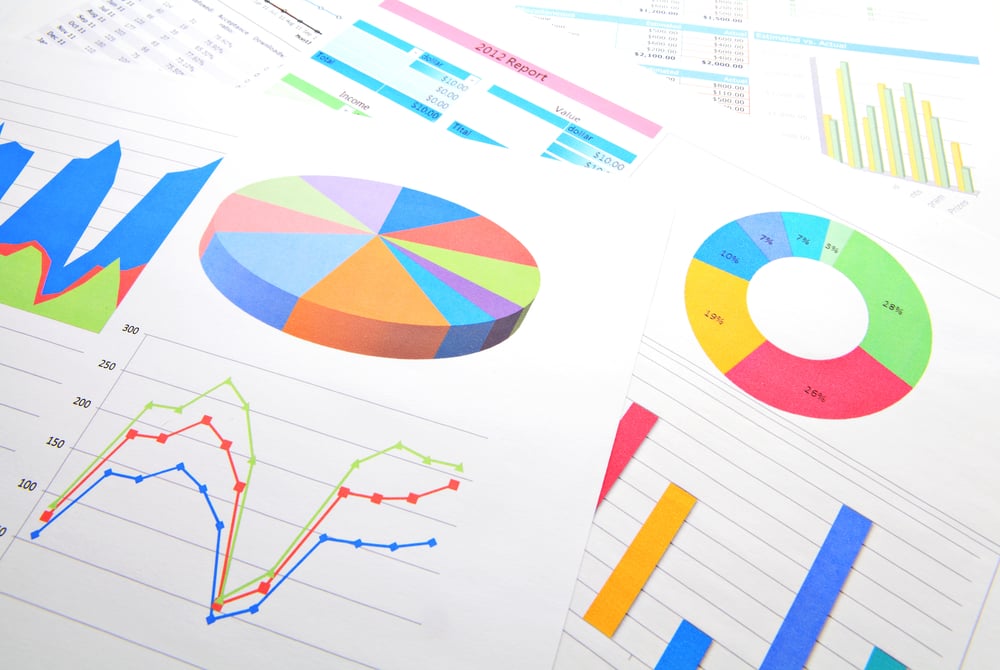
Present your TimeLog data correctly to make summarising and understanding easier. With Accobat's BI tool, data can easily be transferred to e.g. dashboards.

Bizz Zolutions: Migration of accounting data to e-conomic
13 min read
Present your TimeLog data correctly to make summarising and understanding easier. With Accobat's BI tool, data can easily be transferred to e.g. dashboards.

Microsoft Dynamics NAV
15 min read
Present your TimeLog data correctly to make summarising and understanding easier. With Accobat's BI tool, data can easily be transferred to e.g. dashboards.

Gamification makes time tracking fun
22 min read
Present your TimeLog data correctly to make summarising and understanding easier. With Accobat's BI tool, data can easily be transferred to e.g. dashboards.

Integration between Zendesk and TimeLog
11 min read
Present your TimeLog data correctly to make summarising and understanding easier. With Accobat's BI tool, data can easily be transferred to e.g. dashboards.

Keep track of your key figures in one overview with Junu.io
20 min read
Present your TimeLog data correctly to make summarising and understanding easier. With Accobat's BI tool, data can easily be transferred to e.g. dashboards.

Get an overview of your TimeLog data in GoSimplo dashboards
23 min read
Present your TimeLog data correctly to make summarising and understanding easier. With Accobat's BI tool, data can easily be transferred to e.g. dashboards.

Fortnox and TimeLog: Manage projects, time and accounting
17 min read
Present your TimeLog data correctly to make summarising and understanding easier. With Accobat's BI tool, data can easily be transferred to e.g. dashboards.

Ready for international expansion?
23 min read
Present your TimeLog data correctly to make summarising and understanding easier. With Accobat's BI tool, data can easily be transferred to e.g. dashboards.